It is common for commodities to drop in unison, especially metals and oil. In my article on oil, I observed that oil looks set to drop hard soon. This was given added significance by the sharp drop in Precious Metals stocks Feb. 27, that calls time on the recent gold and silver rally that occurred this year to date.
That drop in the precious metals sector, which occurred without a concomitant drop in gold and silver, was the market "tipping its hand" because stocks tend to lead the metals, so we can expect gold and silver to follow suit shortly and drop—along with oil and copper.
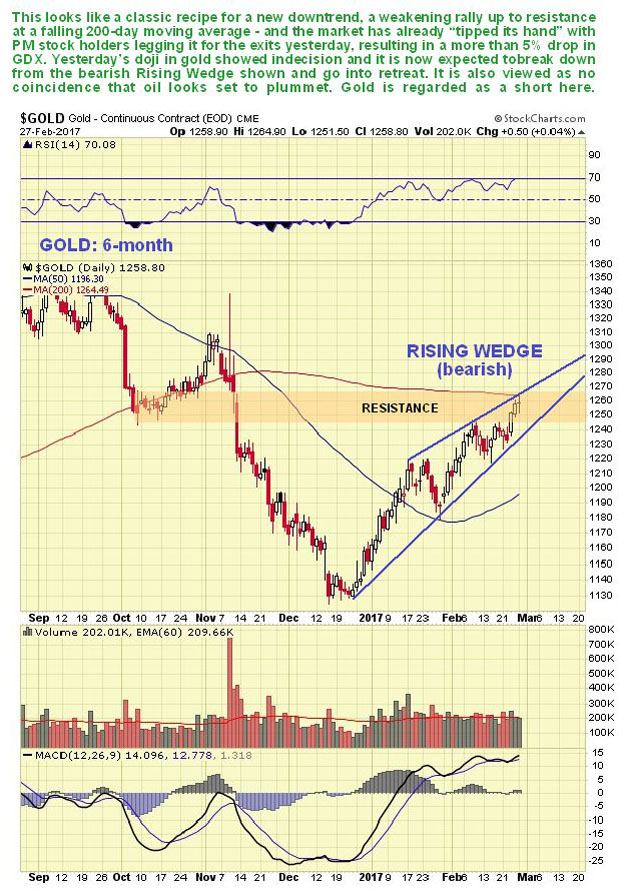
On the 6-month chart for gold we can see that the uptrend is weakening, with it taking the form of a bearish Rising Wedge, and as it has now arrived at significant resistance near to its still falling 200-day moving average, and is rather overbought. It is at a good point to turn lower.
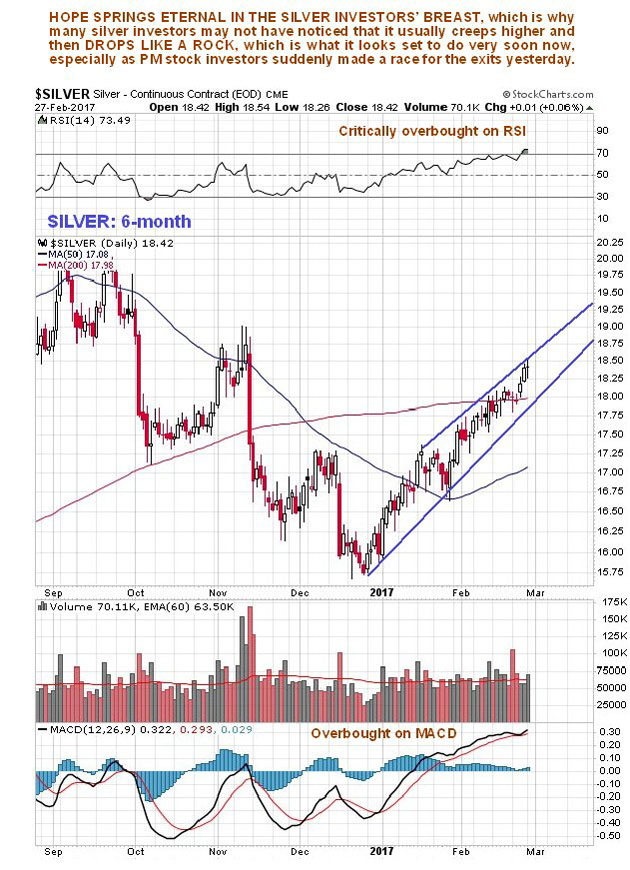
The picture is similar for silver, although its channel is not converging so much, and resistance is not so clearly defined. Silver is critically overbought on its RSI, which doesn't help. Notice on the 6-month chart how silver has a habit of rising in a bumbling, hesitant manner much of the time, and suddenly plunging. We haven't had a plunge for quite a while and one looks due.
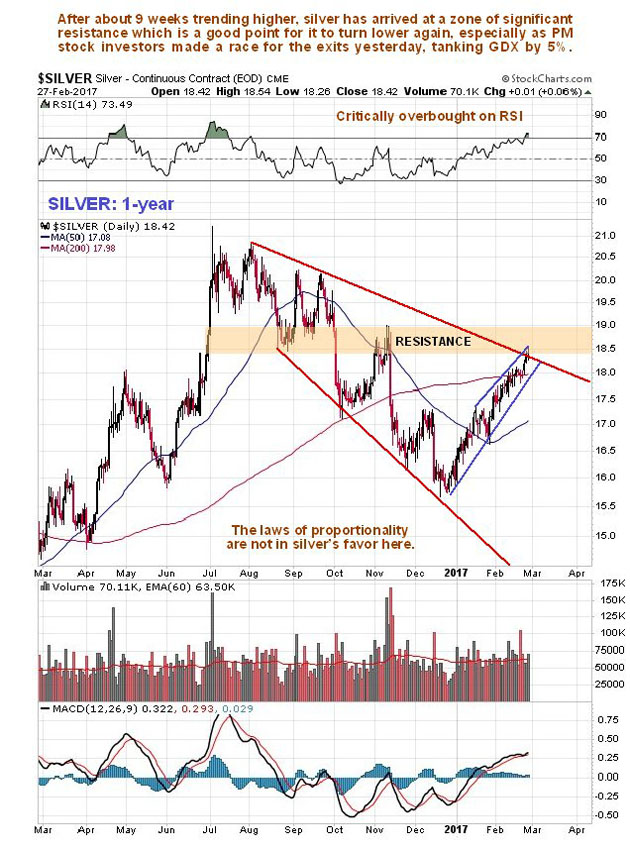
The resistance set to turn silver lower is more clearly visible on its 1-year chart, on which we can see its origins, and we can also see that the laws of proportionality (almost as important as the laws of manipulation) favor silver turning lower, as it has arrived at the upper boundary of a cone shaped downtrend.
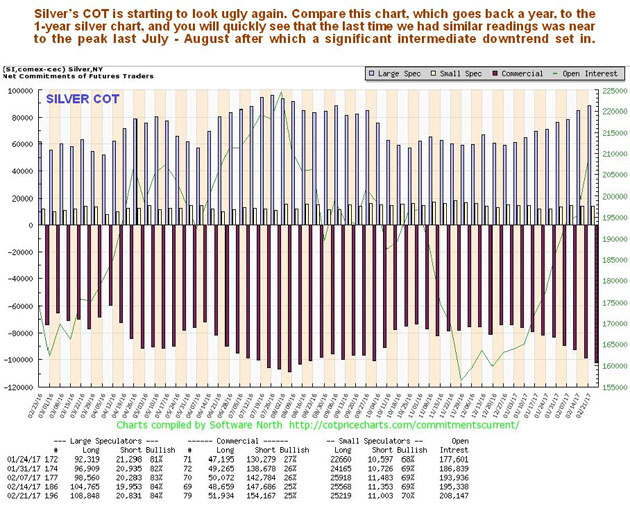
At this point it is worth considering silver's latest COT, which is looking increasingly ugly with high Commercial short and Large Spec long positions again. The last time readings were up at these levels was last July-August, before a lengthy downtrend set in, as we have seen on silver's 1-year chart.
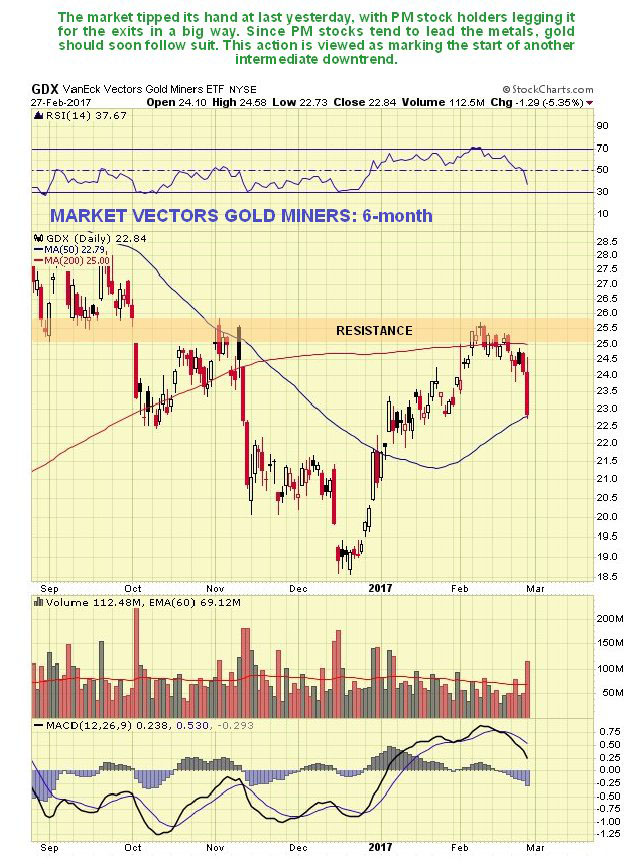
Finally, the charts for GDX (VanEck Vectors Gold Miners ETF) show that the market "tipped its hand" Feb. 27 as it dropped over 5%, which was the biggest drop since last November. Since stocks lead the metals, this chart shows PM stock traders racing for the exits to book profits before a sector downtrend starts, which means that gold and silver should now follow suit and break lower.
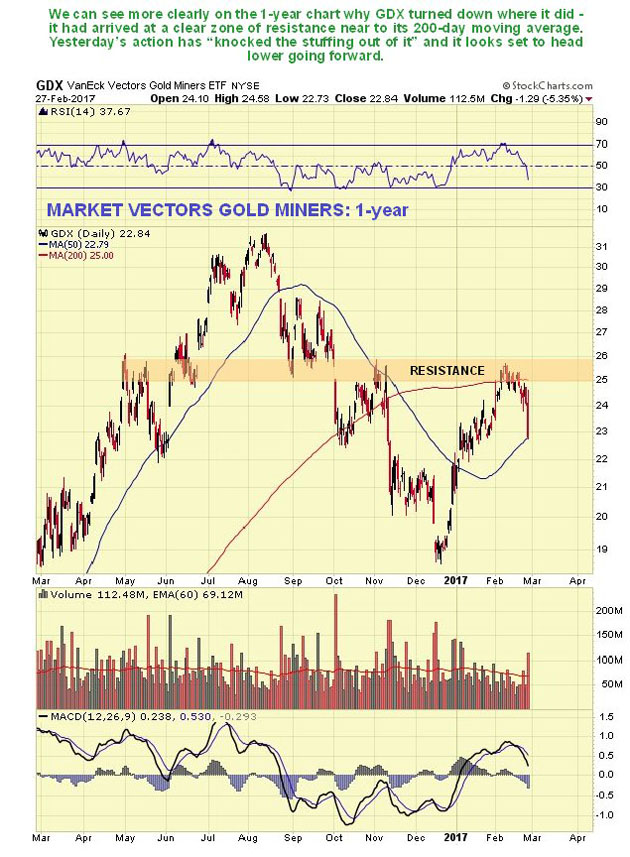
Just why GDX turned lower where it did is made more clear by its 1-year chart, on which we see that it had arrived at a band of quite strong resistance near to its flattening 200-day moving average. This breakdown is believed to mark the start of a sector intermediate downtrend, and oil and copper look set to join in this downside party too. Close stops should therefore be set beneath any open long PM stock positions. Twice leveraged ProShares Ultrashort Gold, code GLL, $75.82, is also recommended for immediate purchase, and a stop may be placed at $73.80.
Clive Maund has been president of www.clivemaund.com, a successful resource sector website, since its inception in 2003. He has 30 years' experience in technical analysis and has worked for banks, commodity brokers and stockbrokers in the City of London. He holds a Diploma in Technical Analysis from the UK Society of Technical Analysts.
Want to read more Gold Report articles like this? Sign up for our free e-newsletter, and you'll learn when new articles have been published. To see recent articles with industry analysts and commentators, visit our Streetwise Interviews page.
Disclosure:
1) Statements and opinions expressed are the opinions of Clive Maund and not of Streetwise Reports or its officers. Clive Maund is wholly responsible for the validity of the statements. Streetwise Reports was not involved in the content preparation. Clive Maund was not paid by Streetwise Reports LLC for this article. Streetwise Reports was not paid by the author to publish or syndicate this article.
2) This article does not constitute investment advice. Each reader is encouraged to consult with his or her individual financial professional and any action a reader takes as a result of information presented here is his or her own responsibility. By opening this page, each reader accepts and agrees to Streetwise Reports' terms of use and full legal disclaimer. This article is not a solicitation for investment. Streetwise Reports does not render general or specific investment advice and the information on Streetwise Reports should not be considered a recommendation to buy or sell any security. Streetwise Reports does not endorse or recommend the business, products, services or securities of any company mentioned on Streetwise Reports.
Charts courtesy of Clive Maund
Published on Clive Maund's members-only website Feb. 28.
from Streetwise Reports - Exclusive Articles https://www.streetwisereports.com/pub/na/17318
No comments:
Post a Comment